
Does 1 inch of rain equal a 1 foot rise in the Carp River?
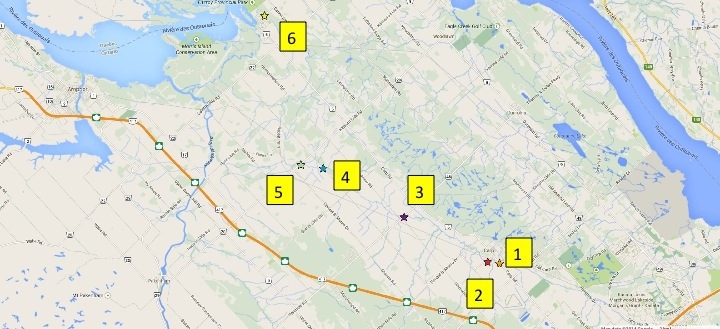
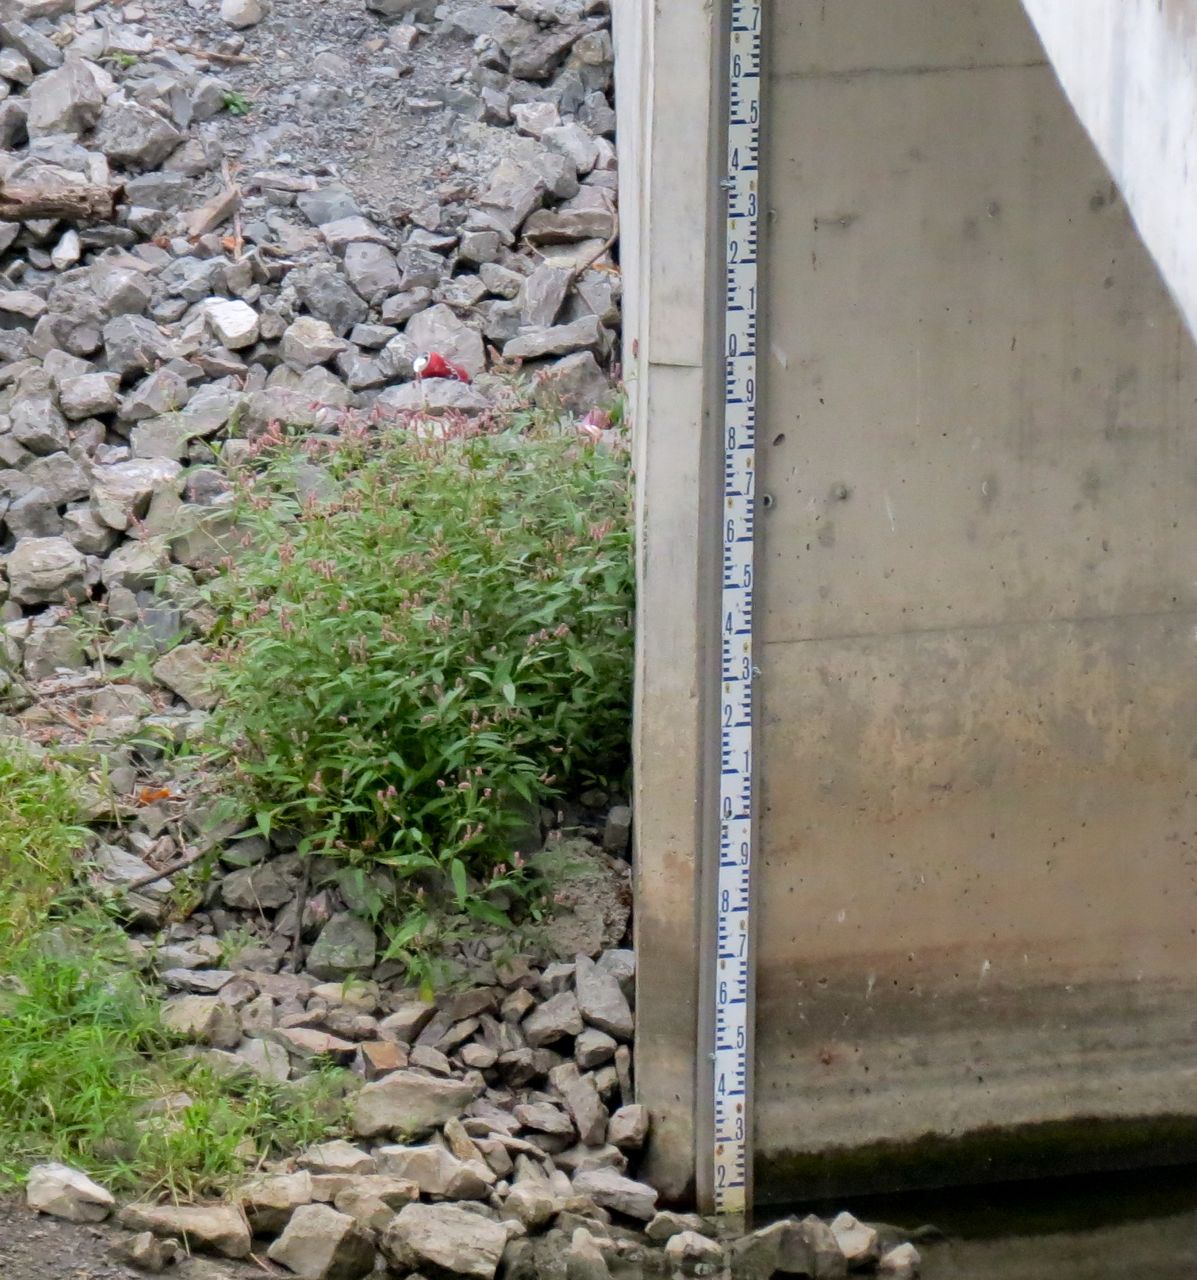
Between August of 2012 and November 2016, volunteers monitored rain fall and water levels at 6 locations along the length of the Carp River. The data were sent to the MVCA for analysis to correlate rain fall with the rise and fall of the Carp River. Unfortunately the river water level gauges were eventually scoured off the bridges by spring ice, putting an end to recording this data. However, rain fall information is still collected in some locations and uploaded to CocoRaHS (Community Collaborative Rain, Hail, and Snow Network), a citizen science site.
The genesis of the program was the need for data to measure changes in the river’s watershed due to upstream development. In addition, anecdotal accounts from long time residents were that downstream flooding, particularly at the village of Carp, had been increasing over the years. The cause(s) for the change are not confirmed, but climate change (increase in number and scale of large rainfall events), increase in upstream runoff from more hardscape, and sedimentation are suspected.
The objectives for the program were to:
1. create baseline water level data along the entire length of the Carp River;
2. monitor changes, if any, over the years as upstream development occurs, particularly at Kanata West in the near term;
3. monitor changes, if any, due to remediation measures, particularly large scale engineered restoration projects (which includes what is being done as part of Kanata West); and
4. calibrate a hydraulic model so that changes can be applied to create river behaviour projections.
Data from volunteers were integrated with data from three MVCA flow gauges in the river, which are located at Maple Grove in Kanata, Richardson Side Road, and Kinburn.
Trends
The MVCA has been monitoring flow rates at Kinburn since 1972. These are measurements taken at a single point in the river, but some conclusions can be drawn. There is less water flowing in the Carp River averaged over the year likely due to lower snow fall, but there is more water in the river in the summer:

The MVCA has been monitoring flow rates at Kinburn since 1972. These are measurements taken at a single point in the river, but some conclusions can be drawn. There is less water flowing in the Carp River averaged over the year likely due to lower snow fall, but there is more water in the river in the summer:
- The maximum annual flow has been decreasing. This correlates with less snow melt.
- The mean annual flow has decreased slightly.
- The maximum summer flow has been increasing, likely due to more frequent and larger summer storms.
- Mean summer flows are increasing. While a trend in higher temperatures should lead to more evapotranspiration, it is believed that summer flow rates are higher due to more hard surfaces upstream.
- The minimum summer 7-day mean flow has been increasing.
Learn More
Read about the federal government’s Carp River water monitoring station near Kinburn.
View historical graphs from the Kinburn station in PDF.